.png)


.png)
.png)
.png)
.png)
Reporting & Analytics
Dashboard
Simple charts that show who’s trained, who’s clicking, and who needs help.
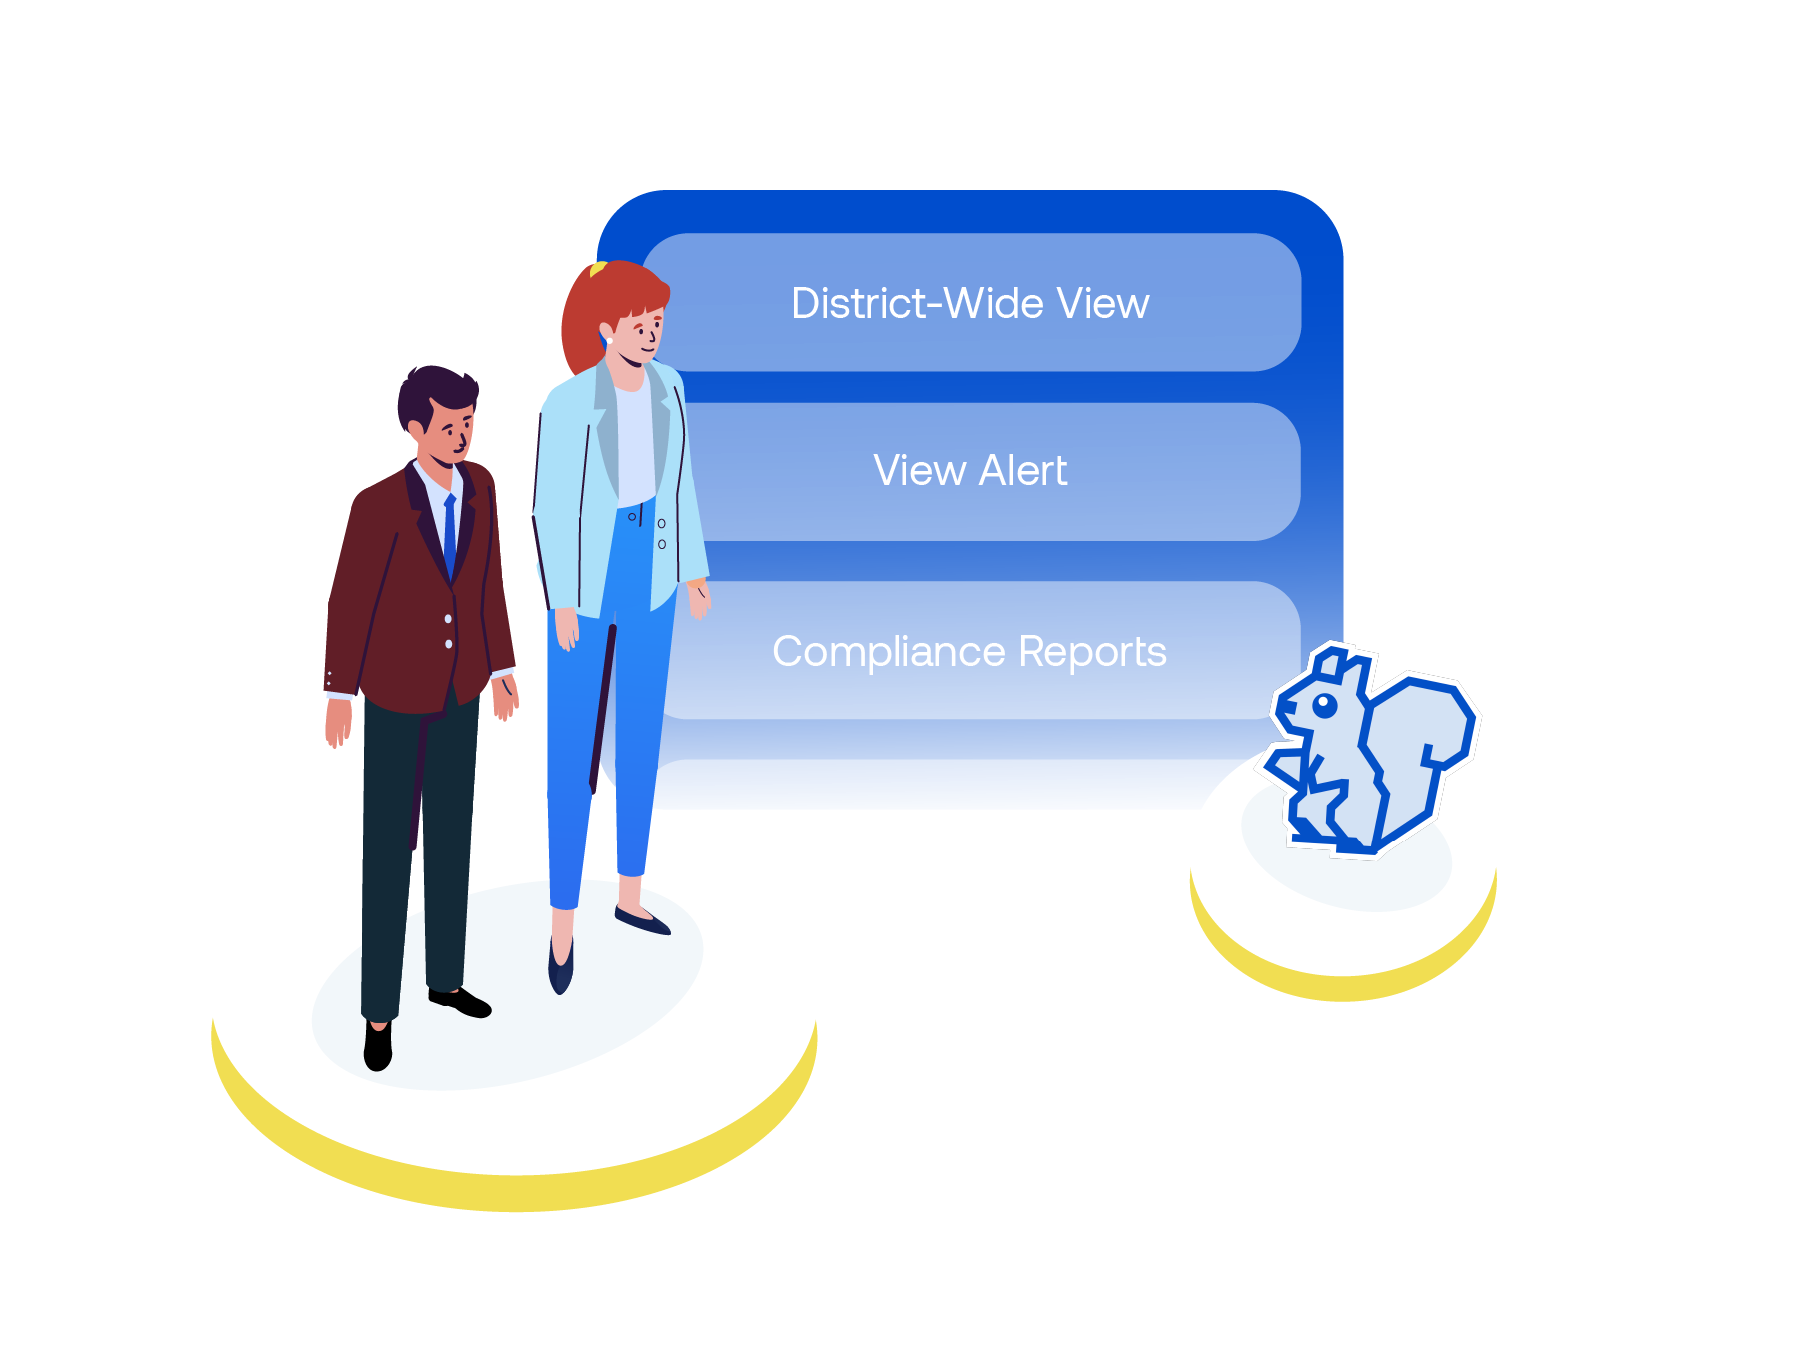
Know Who’s Safe at a Glance.
CyberNut’s dashboard gives district IT leaders complete visibility into phishing simulations, compliance training, micro-learning outcomes, and real threat reports. Whether you're looking for a high-level summary or user-level details, everything is organized, exportable, and easy to action.
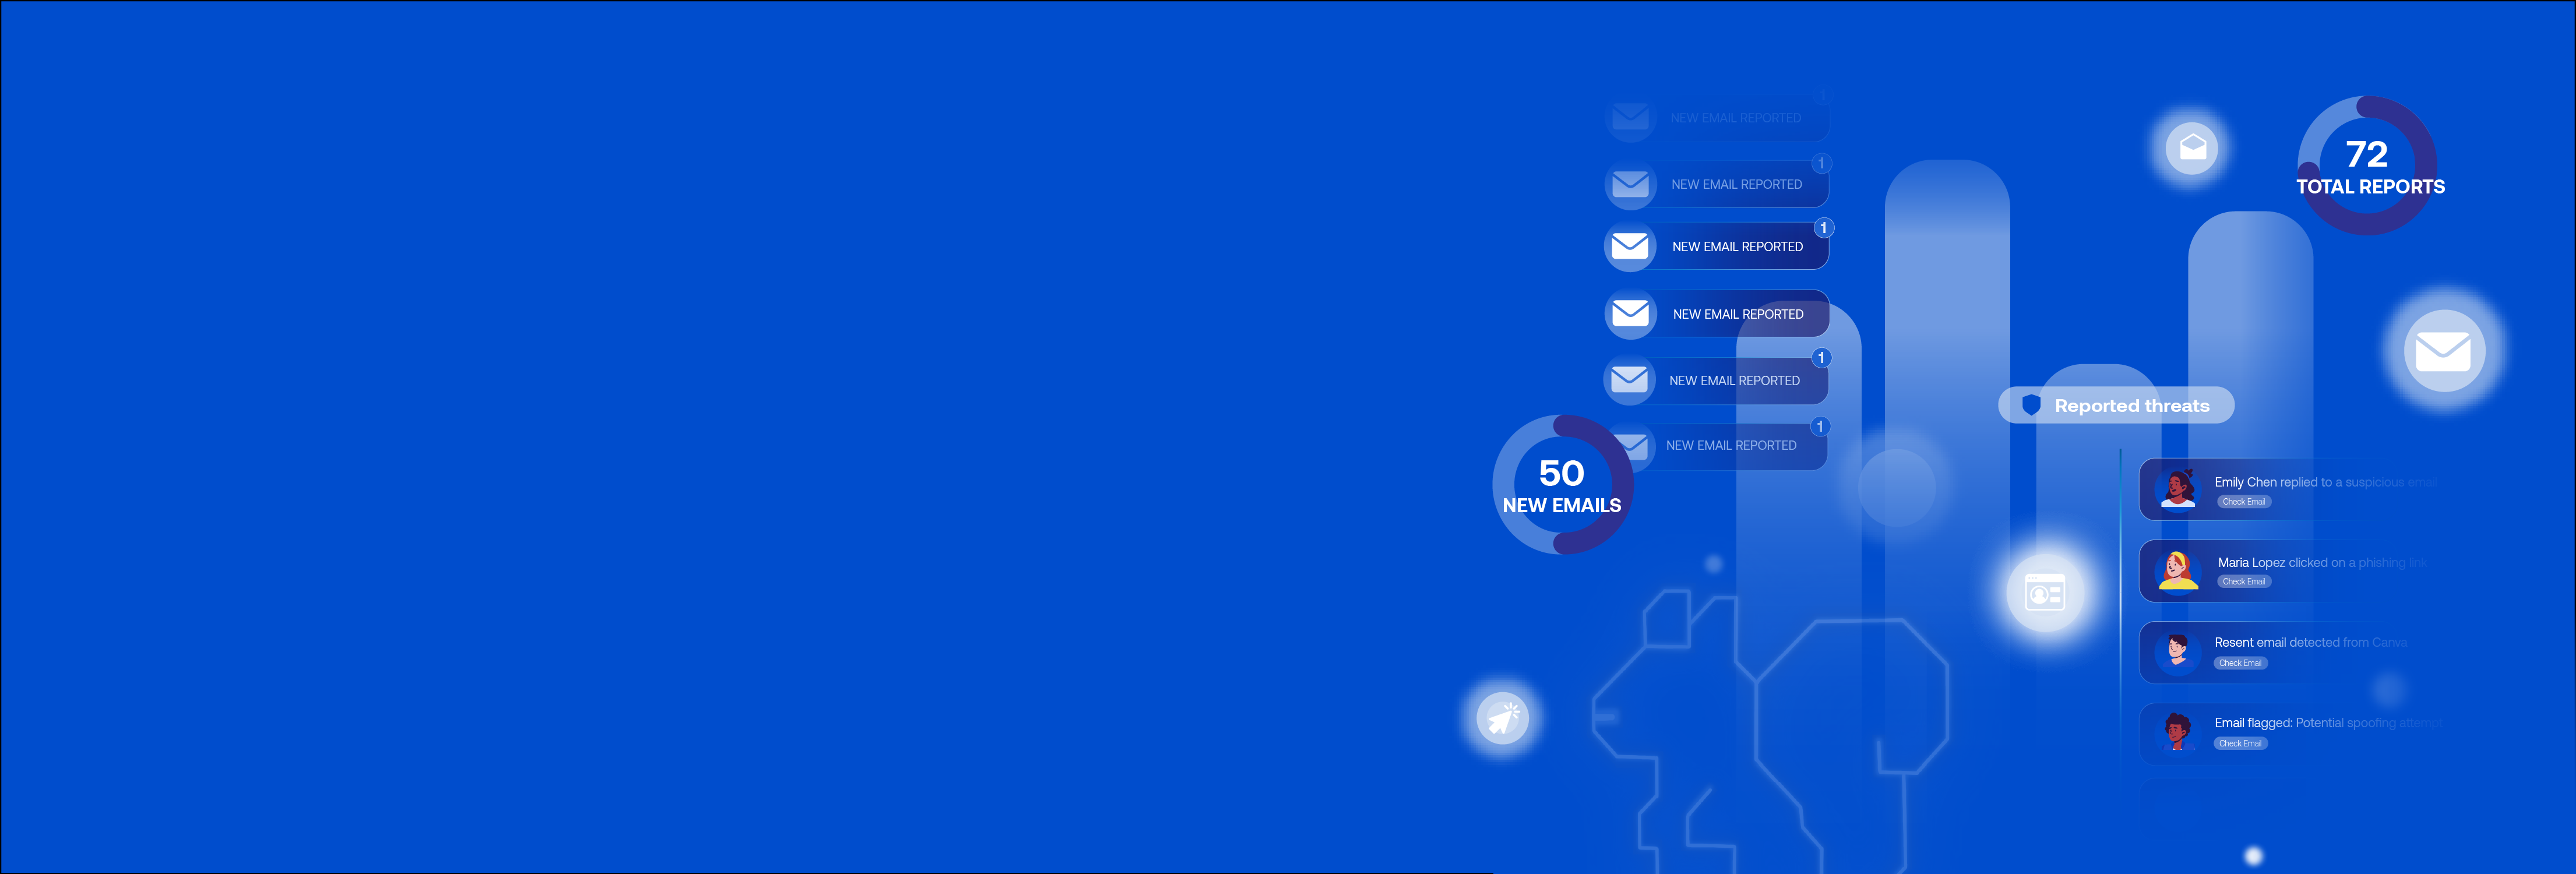
Real-Time Campaign Overview
See your full campaign performance in one place—clicks vs. reports, training completion, pass rates, and top phishing risks. Track progress with a live leaderboard and highlight wins for cabinet meetings or board updates.
Sub-Campaign & Team Insights
Easily view training performance by building, department, or role—like middle school vs. high school or Finance vs. HR vs. Teachers. The Teams tab shows group-level clicks, reports, pass rates, and leaderboards by location, so you can compare performance across your district while still seeing the full picture.
Drill Down to Individual Users
See user-level activity with full context: emails sent, clicked, reported, skipped; training assigned and completed; even view the exact phishing email they received. Fully exportable for audits or coaching.
Leaderboards & Gamification
Motivate participation with gamification. Track acorns earned, rank users and teams, display live leaderboards, and spark friendly competition between schools or departments—making security awareness something staff actually enjoy.
Exportable Reports
See user-level activity with full context: emails sent, clicked, reported, skipped; training assigned and completed; even view the exact phishing email they received. Fully exportable for audits or coaching.
Know Who’s Safe at a Glance.
CyberNut’s dashboard gives district IT leaders complete visibility into phishing simulations, compliance training, micro-learning outcomes, and real threat reports. Whether you're looking for a high-level summary or user-level details, everything is organized, exportable, and easy to action.
Real-Time Campaign Overview
See your full campaign performance in one place—clicks vs. reports, training completion, pass rates, and top phishing risks. Track progress with a live leaderboard and highlight wins for cabinet meetings or board updates.
Sub-Campaign & Team Insights
Easily view training performance by building, department, or role—like middle school vs. high school or Finance vs. HR vs. Teachers. The Teams tab shows group-level clicks, reports, pass rates, and leaderboards by location, so you can compare performance across your district while still seeing the full picture.
Drill Down to Individual Users
See user-level activity with full context: emails sent, clicked, reported, skipped; training assigned and completed; even view the exact phishing email they received. Fully exportable for audits or coaching.
Leaderboards & Gamification
Motivate participation with gamification. Track acorns earned, rank users and teams, display live leaderboards, and spark friendly competition between schools or departments—making security awareness something staff actually enjoy.
Exportable Reports
See user-level activity with full context: emails sent, clicked, reported, skipped; training assigned and completed; even view the exact phishing email they received. Fully exportable for audits or coaching.
Cyber Safety, Made Fun and Easy for Students
Quickly Find Problems
The dashboard shows who is safe and who needs help fast.
Easy-to-Share Reports
Simple reports help you show your leaders how much safer your schools have become.
Always Know the Score
Monthly tracking means you always know how well you’re doing.
Reporting & Analytics Dashboard
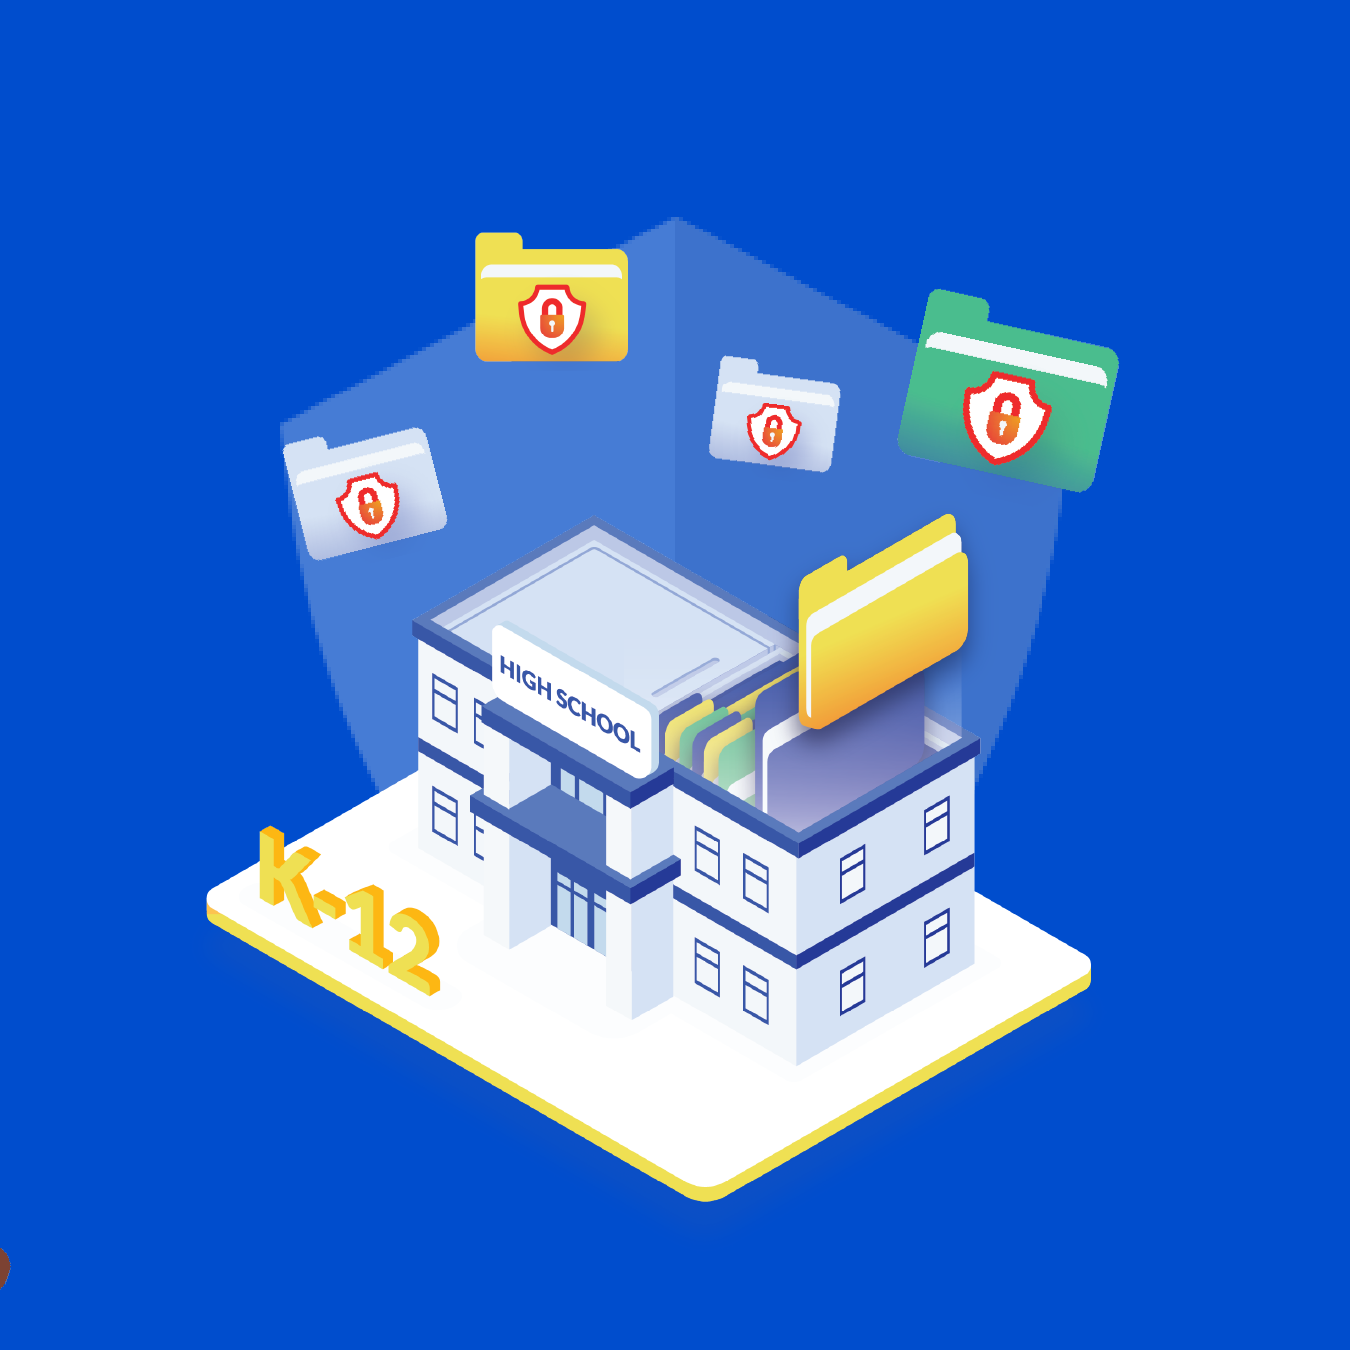
For Staff & IT Admins
Discover the CyberNut K-12 Security Platform
CyberNut helps you track and prove that your schools are getting safer each day. See your district’s progress clearly and easily
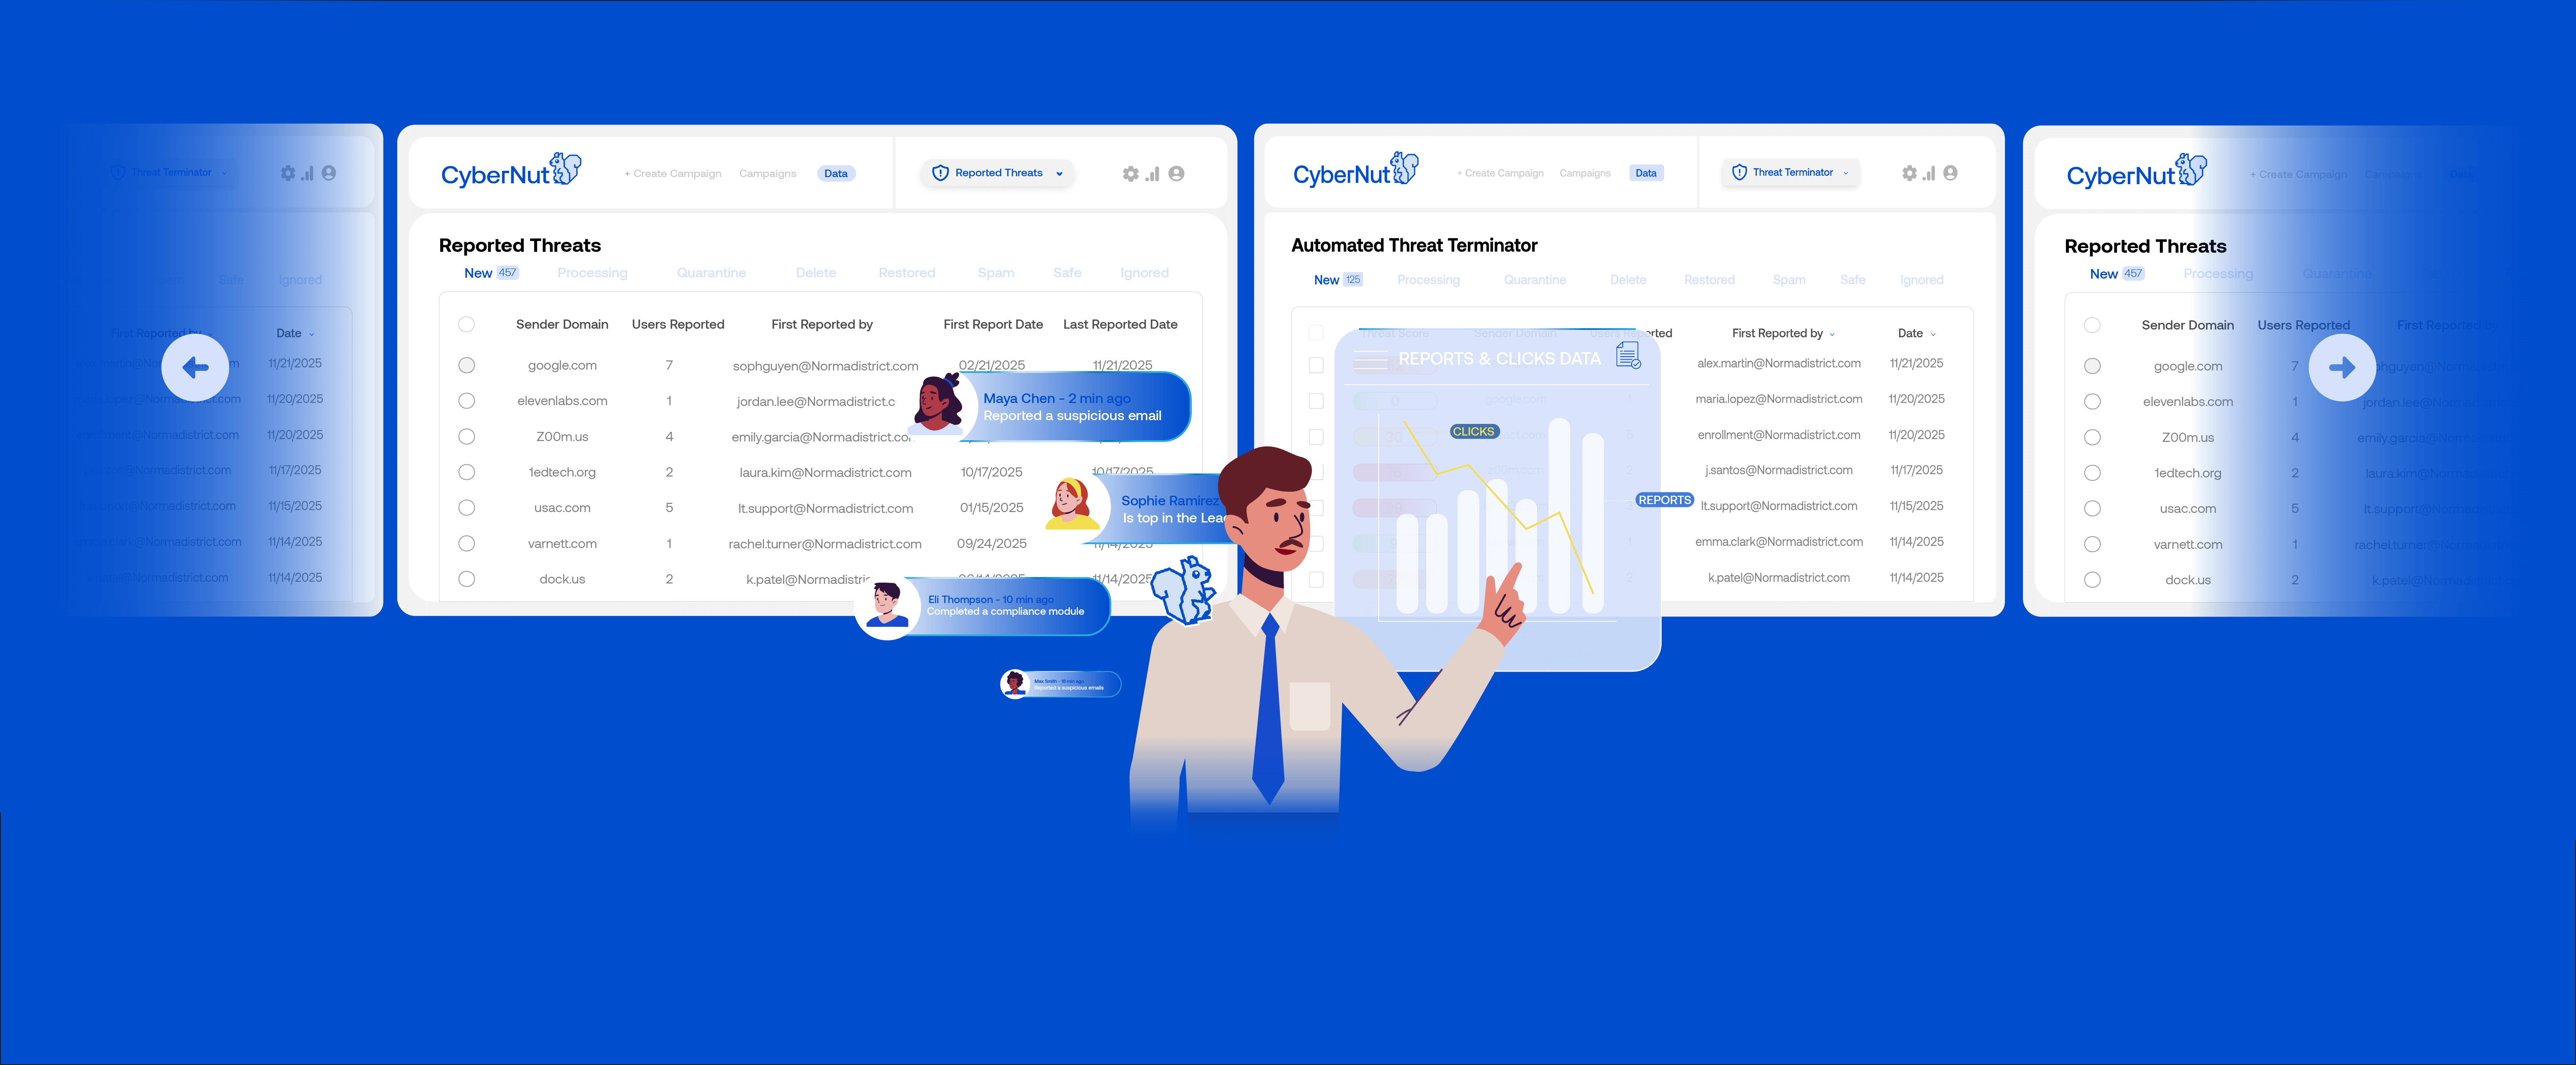
All Your Phishing & Compliance Training Data — In One Smart, User-Friendly Dashboard
Monitor every click, report, training completion, and threat—live and in real time. CyberNut’s user-friendly dashboard gives IT teams clarity, control, and confidence.
FAQs
Your questions about the Reporting & Analytics Dashboard answered here.
The Active Threat Manager scans incoming emails in real-time. When a phishing threat is detected, it allows staff to delete it instantly. This process ensures that threats are neutralized before they can cause harm.
The dashboard helps IT teams and administrators by providing clear visibility into user engagement and risk levels. It allows for confident presentations to school boards, showcasing where improvements are needed. This ensures that support is directed where it’s most effective.
Absolutely! The dashboard is designed with accessibility in mind, making it easy for all users to navigate. Its intuitive interface allows administrators to quickly find the information they need. This means less time learning the tool and more time focusing on security.
Yes, we offer live demos of the Reporting & Analytics Dashboard. This allows you to see its features in action and understand how it can benefit your district. Schedule a demo today to explore its capabilities.
We provide comprehensive support for all users of the dashboard. Our team is available to assist with any questions or issues that may arise. Additionally, we offer training resources to help users maximize the tool's potential.
Still have questions?
Connect with our team today!